Figure 2
Diabetes and red blood cell parameters
Md. Sadikuj Jaman*, Md. Sohanur Rahman, Rubaiya Rafique Swarna, Joyanto Mahato, Md. Milon Miah and Mosa. Ayshasiddeka
Published: 08 January, 2018 | Volume 2 - Issue 1 | Pages: 001-009
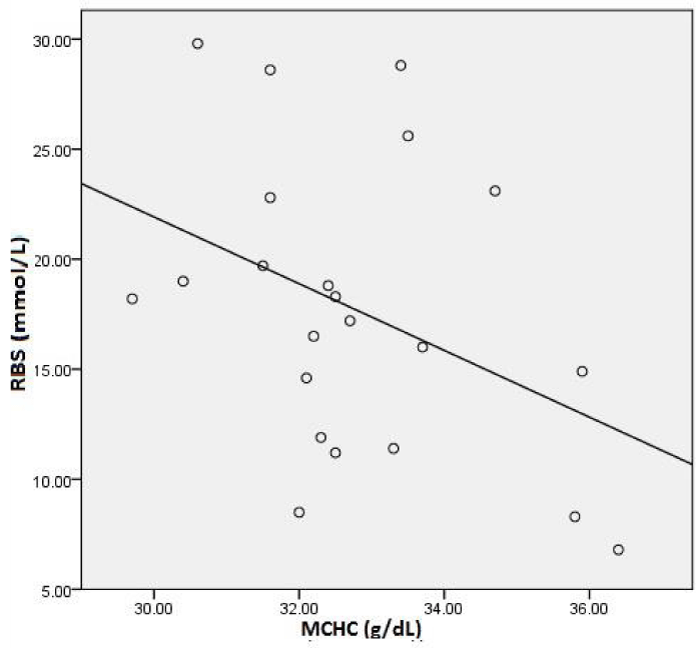
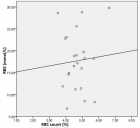
Figure 2:
Correlation analysis between Mean Corpuscular Hemoglobin Concentration (MCHC) and Random blood sugar (RBS) levels in the total sample.
Read Full Article HTML DOI: 10.29328/journal.acem.1001004 Cite this Article Read Full Article PDF
More Images
Similar Articles
-
Diabetes and red blood cell parametersMd. Sadikuj Jaman*,Md. Sohanur Rahman,Rubaiya Rafique Swarna,Joyanto Mahato,Md. Milon Miah,Mosa. Ayshasiddeka. Diabetes and red blood cell parameters. . 2018 doi: 10.29328/journal.acem.1001004; 2: 001-009
-
Comparison of Efficacy and Safety of Hydroxychloroquine and Teneligliptin in Type 2 Diabetes Patients who are Inadequately Controlled with Glimepiride, Metformin and Insulin therapy: A Randomized Controlled Trial with Parallel Group DesignPrakash Ranjan,Sajjad Ahsan*,Rabi Bhushan,Bipin Kumar,Tushar,Anup Kumar Gupta,Anand Kumar Verma,Mukesh Jain. Comparison of Efficacy and Safety of Hydroxychloroquine and Teneligliptin in Type 2 Diabetes Patients who are Inadequately Controlled with Glimepiride, Metformin and Insulin therapy: A Randomized Controlled Trial with Parallel Group Design. . 2018 doi: 10.29328/journal.acem.1001009; 2: 033-040
-
Effects of dietary supplementation on progression to type 2 diabetes in subjects with prediabetes: a single center randomized double-blind placebo-controlled trialSathit Niramitmahapanya*,Preeyapat Chattieng,Tiersidh Nasomphan,Korbtham Sathirakul. Effects of dietary supplementation on progression to type 2 diabetes in subjects with prediabetes: a single center randomized double-blind placebo-controlled trial. . 2023 doi: 10.29328/journal.acem.1001026; 7: 00-007
Recently Viewed
-
Environmental Factors Affecting the Concentration of DNA in Blood and Saliva Stains: A ReviewDivya Khorwal*, GK Mathur, Umema Ahmed, SS Daga. Environmental Factors Affecting the Concentration of DNA in Blood and Saliva Stains: A Review. J Forensic Sci Res. 2024: doi: 10.29328/journal.jfsr.1001057; 8: 009-015
-
Markov Chains of Molecular Processes of Biochemical MaterialsOrchidea Maria Lecian*. Markov Chains of Molecular Processes of Biochemical Materials. Int J Phys Res Appl. 2024: doi: 10.29328/journal.ijpra.1001076; 7: 001-005
-
Generation of Curved Spacetime in Quantum FieldSarfraj Khan*. Generation of Curved Spacetime in Quantum Field. Int J Phys Res Appl. 2024: doi: 10.29328/journal.ijpra.1001077; 7: 006-009
-
Optimizing Milk Safety: Applying Nuclear Techniques in X-ray Fluorescence Spectroscopy for Heavy Metal Quantification in Powdered Milk Consumed in SenegalPapa Macoumba Faye*, Djicknack Dione, Oumar Ndiaye, Moussa Hamady SY, Nogaye Ndiaye, Alassane Traore, Ababacar Sadikhe Ndao. Optimizing Milk Safety: Applying Nuclear Techniques in X-ray Fluorescence Spectroscopy for Heavy Metal Quantification in Powdered Milk Consumed in Senegal. Int J Phys Res Appl. 2024: doi: 10.29328/journal.ijpra.1001078; 7: 010-015
-
Thermoelectric Materials Based on Lead Telluride and Prospects for their Practical ApplicationYuriy Pavlovskyy*, Nadiya Pavlovska. Thermoelectric Materials Based on Lead Telluride and Prospects for their Practical Application. Int J Phys Res Appl. 2024: doi: 10.29328/journal.ijpra.1001079; 7: 016-018
Most Viewed
-
Evaluation of Biostimulants Based on Recovered Protein Hydrolysates from Animal By-products as Plant Growth EnhancersH Pérez-Aguilar*, M Lacruz-Asaro, F Arán-Ais. Evaluation of Biostimulants Based on Recovered Protein Hydrolysates from Animal By-products as Plant Growth Enhancers. J Plant Sci Phytopathol. 2023 doi: 10.29328/journal.jpsp.1001104; 7: 042-047
-
Sinonasal Myxoma Extending into the Orbit in a 4-Year Old: A Case PresentationJulian A Purrinos*, Ramzi Younis. Sinonasal Myxoma Extending into the Orbit in a 4-Year Old: A Case Presentation. Arch Case Rep. 2024 doi: 10.29328/journal.acr.1001099; 8: 075-077
-
Feasibility study of magnetic sensing for detecting single-neuron action potentialsDenis Tonini,Kai Wu,Renata Saha,Jian-Ping Wang*. Feasibility study of magnetic sensing for detecting single-neuron action potentials. Ann Biomed Sci Eng. 2022 doi: 10.29328/journal.abse.1001018; 6: 019-029
-
Pediatric Dysgerminoma: Unveiling a Rare Ovarian TumorFaten Limaiem*, Khalil Saffar, Ahmed Halouani. Pediatric Dysgerminoma: Unveiling a Rare Ovarian Tumor. Arch Case Rep. 2024 doi: 10.29328/journal.acr.1001087; 8: 010-013
-
Physical activity can change the physiological and psychological circumstances during COVID-19 pandemic: A narrative reviewKhashayar Maroufi*. Physical activity can change the physiological and psychological circumstances during COVID-19 pandemic: A narrative review. J Sports Med Ther. 2021 doi: 10.29328/journal.jsmt.1001051; 6: 001-007

HSPI: We're glad you're here. Please click "create a new Query" if you are a new visitor to our website and need further information from us.
If you are already a member of our network and need to keep track of any developments regarding a question you have already submitted, click "take me to my Query."


